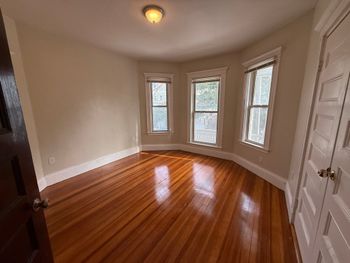

A different way to compare housing prices
A February 2020 Boston City Properties article discussed a study that compared housing markets by median price per square foot rather than median home price alone. The study used a national median list-price budget of $305,000 and asked how much space that sum would represent in selected cities.
The account attributed a $1,160-per-square-foot figure to Boston and used it to illustrate approximately 263 square feet for that hypothetical budget. That calculation was not an actual listing for a 263-square-foot home, and it did not establish that such a home could be bought for $305,000.
Geography and method matter
The article also quoted different neighborhood figures for Mattapan, Hyde Park and West Roxbury. The large differences underscored the need to know the geographic coverage, property mix and date of a price series before treating it as representative of every Boston home.
The underlying website was not named in the account, and the description moved between a large-city study and a smaller comparison sample. The ranking is therefore retained as the article’s historical report, not an independently verified current conclusion that Boston is the nation’s most expensive market. A per-square-foot measure can illuminate one aspect of price without replacing property-specific comparisons.
Historical attribution: Original Boston City Properties article, February 2020. Reported claims and attributed assessments have not been independently refreshed.